Understanding Rough Order of Magnitude Estimates for Production Lines
Capacity and Capital Cost in Food Processing
One of the most important patterns in industrial engineering is that the cost of production equipment does not increase proportionally with capacity. When a processing line becomes larger, the investment per unit of production generally becomes lower. This phenomenon is known as the economy of scale and it is observed across almost all process industries, including the food sector.
In practical terms this means that a factory capable of producing ten times more product does not require ten times more capital investment. Instead, the total investment increases more slowly than the capacity. As a result, the capital cost per ton of product decreases significantly as plant size grows. This is one of the key drivers behind the development of large-scale food manufacturing plants.
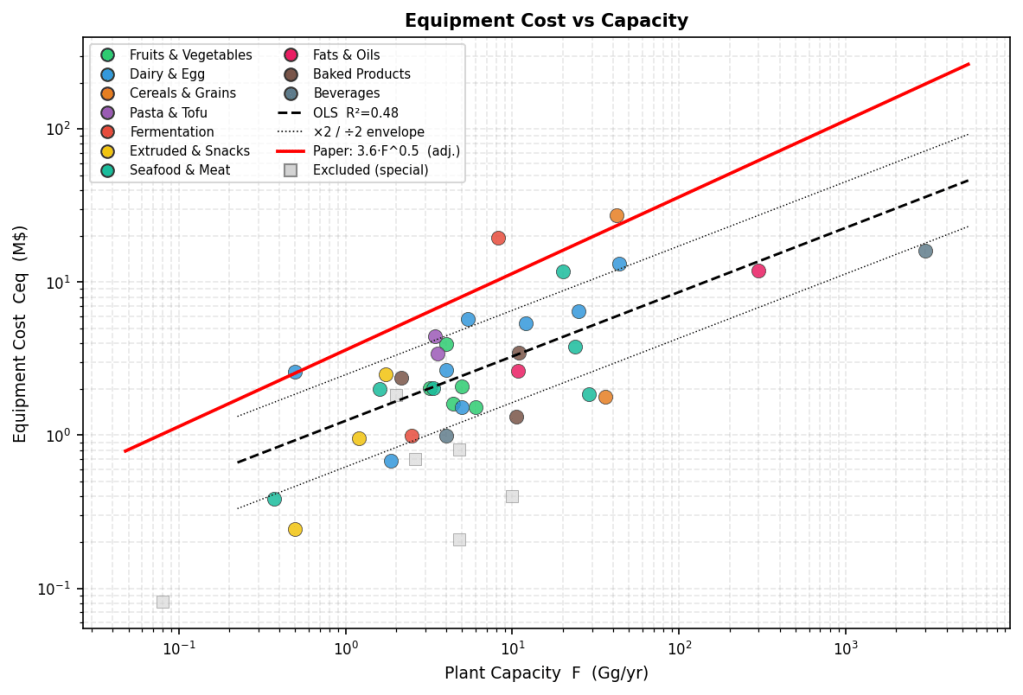
The dataset analyzed in this article, originally derived from an engineering study published in the late 1980s, illustrates this principle very clearly. When production capacity is plotted against the capital cost per ton of production, the relationship follows a very consistent downward trend. Smaller factories show relatively high capital costs per ton, while larger plants become progressively more efficient from an investment perspective.
Across the combined dataset the general trend indicates that doubling the capacity of a plant reduces the capital investment per ton by roughly thirty to thirty-five percent. This observation aligns closely with what process engineers have long experienced in practice. Larger installations allow for better utilization of equipment, shared utilities, and more efficient plant layouts. Equipment sizes also scale favorably, meaning that pumps, heat exchangers, reactors and other process units can often handle higher capacities without proportional increases in cost.
For engineers working on early-stage projects, this relationship between capacity and cost provides a powerful tool. It allows a first estimate of equipment investment to be made even when only the production scale is known.
The Impact of Inflation on Equipment Costs
Because the original dataset dates back several decades, it is necessary to account for inflation before applying the results to modern food factory projects. Equipment prices have changed significantly since the 1980s, not only due to general inflation but also because of technological developments and stricter regulatory requirements.
Food processing equipment today often requires more advanced hygienic design, improved automation systems, higher levels of traceability, and additional food safety features. Stainless steel prices, energy costs, and engineering services have also increased over time. All of these factors contribute to higher capital costs compared with historical benchmarks.
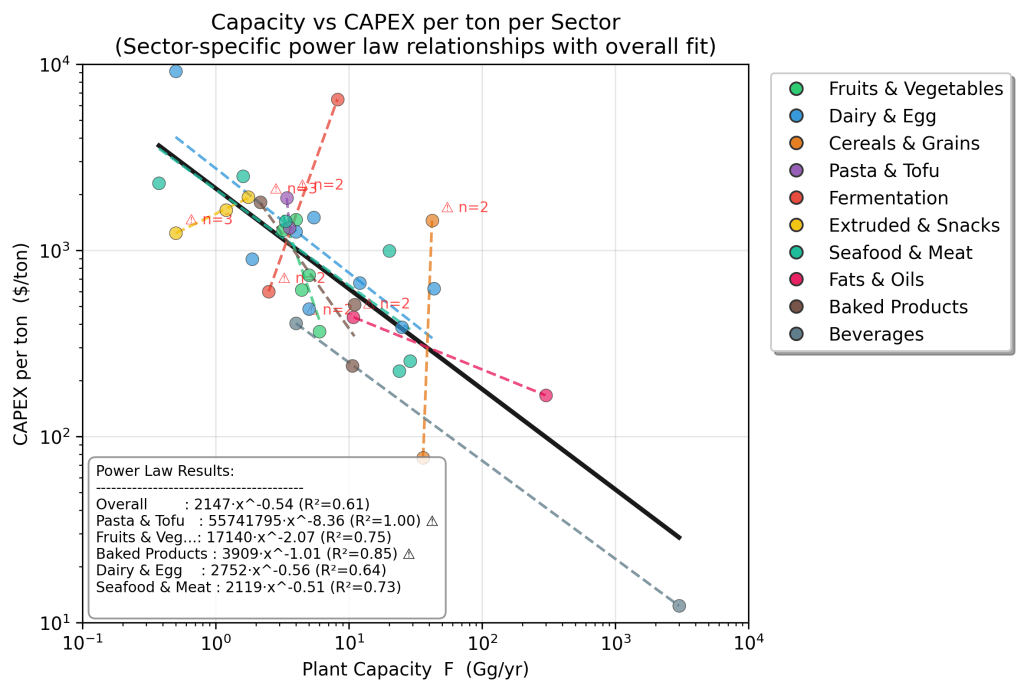
To illustrate this effect, the historical cost relationship has been adjusted using approximate inflation factors for several reference years. When this adjustment is applied, the overall shape of the cost curve remains almost identical, but the entire curve shifts upward. In other words, the fundamental relationship between plant size and investment remains stable, while the absolute cost level increases.
When comparing the late 1980s with the present day, a reasonable approximation is that equipment investment levels have roughly tripled. This means that a processing line that might have required one million dollars of equipment investment in 1987 would require approximately three million today, assuming similar technology and capacity.
The graphs included in this article illustrate this effect clearly. Each curve represents the same capacity relationship, but adjusted for different time periods. The slope remains nearly identical, confirming that the underlying scaling behavior has not fundamentally changed over the past forty years.
Differences Between Food Processing Sectors
Although the general scaling pattern is consistent across the food industry, there are important differences between individual sectors. Some processes require far more specialized equipment than others and therefore show much higher capital intensity.
Fermentation processes are a good example of this. These installations require large stainless steel reactors, sterilization systems, sophisticated process control and often extensive downstream purification equipment. As a result, fermentation plants tend to have some of the highest capital investments per ton of product.
Dairy processing can also fall into the high investment category, particularly when spray drying or membrane filtration technologies are involved. These operations rely on complex thermal systems and high-energy equipment that significantly increase the capital intensity of the plant.
In contrast, certain types of food processing rely more heavily on mechanical operations such as washing, cutting, conveying and packaging. Fruit and vegetable processing lines often fall into this category. While these plants still require substantial investments, the capital cost per ton is typically lower than for fermentation or biochemical production facilities.
Bakery and snack production lines occupy a middle ground. They require specialized ovens, mixers, forming equipment and extrusion systems, but the overall complexity is generally lower than in fermentation or dairy powder production.
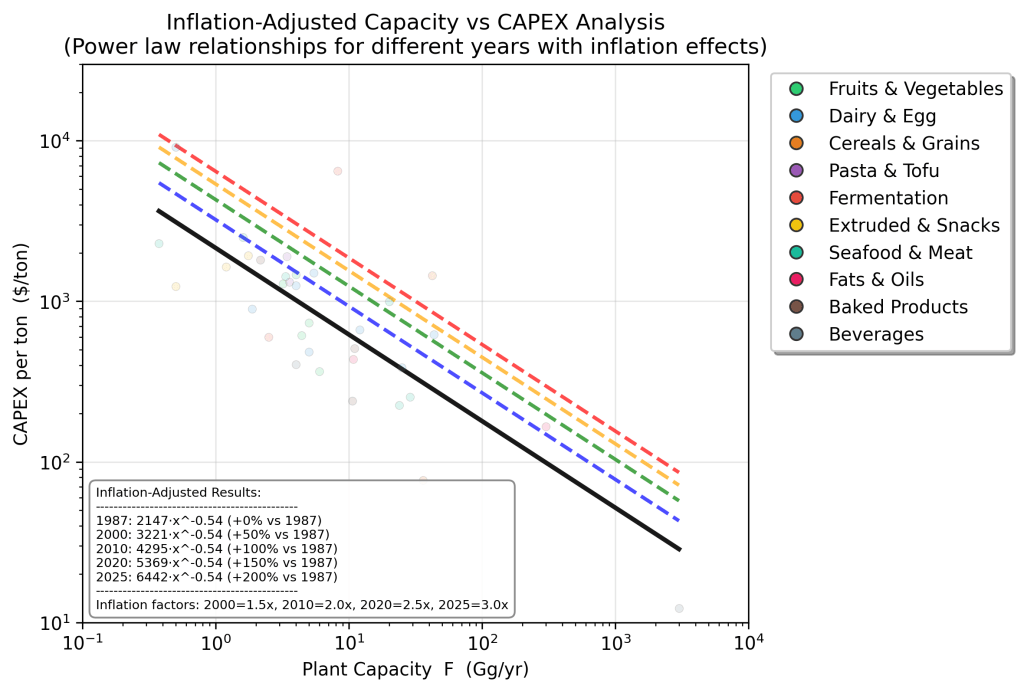
The second graph presented in this article illustrates these sector differences. Although all sectors follow a similar general trend, the starting level of capital investment varies widely depending on the type of process technology involved.
For engineers and investors, this observation is important. It highlights that early cost estimates should always consider the technological characteristics of the product being manufactured.
From Machine CAPEX to Total Factory Investment
The relationships shown in the graphs focus specifically on the investment in the processing line itself. However, when a new food factory is built, the production equipment typically represents only part of the total capital investment.
A complete facility requires buildings, structural works, utility systems, refrigeration installations, compressed air networks, water treatment facilities, and logistics infrastructure such as warehouses and loading docks. Electrical systems, automation platforms, installation costs, and engineering services must also be included.
For this reason, engineers often convert the estimated machine investment into a total project investment using a multiplication factor. In many food factory projects the processing equipment represents roughly half to two thirds of the total investment. As a result, a simple rule of thumb is to multiply the equipment cost by a factor between 1.5 and 2.0 in order to obtain a first estimate of the total capital expenditure.
For relatively simple processing facilities the multiplier tends to be closer to the lower end of this range. Highly complex plants that require extensive utilities, environmental systems, or advanced automation may require a significantly higher factor.
Although this method remains approximate, it is widely used during the earliest phases of project development because it allows a first estimate of total investment to be generated quickly.
How Engineers Use These Curves in Early Project Stages
Capacity-cost curves such as the ones presented here are particularly useful in the concept and feasibility phases of industrial projects. At this stage of a project only limited information is available. The product concept may be defined, and the approximate production volume may be known, but detailed process design and equipment specifications have not yet been developed.
Despite this limited information, management and investors often require an initial estimate of the potential investment. The scaling relationships described above allow engineers to produce such estimates with reasonable confidence.
By estimating the capital cost of the processing equipment and applying an appropriate multiplication factor, it becomes possible to generate a first Rough Order of Magnitude investment estimate. This estimate can then be used to evaluate the economic viability of the project, compare different production scales, or initiate discussions with investors and financing institutions.
Although the uncertainty of these estimates remains significant, they provide an essential starting point for further engineering work.
The Limits of Rough Order of Magnitude Estimates
It is important to recognize that ROM estimates are inherently uncertain. Their purpose is to guide early decision-making, not to predict final project costs with high precision.
Numerous factors can influence the final capital investment of a food factory. Local construction costs, regulatory requirements, energy infrastructure, and labor conditions all play a role. The level of automation and the hygienic classification of the plant can also have a major impact on cost.
As the project progresses into feasibility studies, basic engineering, and detailed engineering, the investment estimate gradually becomes more precise. What begins as a broad range in the early concept phase eventually evolves into a detailed project budget supported by equipment quotations and construction contracts.
Concluding Remarks
Despite the complexity of food manufacturing technology, the relationship between production capacity and capital investment follows a surprisingly consistent pattern. Larger plants almost always achieve lower capital costs per ton of production due to economies of scale.
Historical engineering datasets remain highly valuable for understanding this relationship. When adjusted for inflation, they provide useful reference points for modern food factory projects.
For engineers working on early-stage investment studies, these capacity-cost relationships offer a practical way to estimate machine investment and translate it into a first approximation of total factory cost. Although such estimates remain rough, they provide the foundation for strategic decision-making and the first evaluation of a new food processing project.


Leave a comment